Digital Marketing Analytics Basics: What Beginners Should Track First
Digital marketing analytics basics are not about watching every number on a dashboard. Beginners should first track five decision areas: where visitors come from, what pages they.


Digital marketing analytics basics are not about watching every number on a dashboard. Beginners should first track five decision areas: where visitors come from, what pages they engage with, which actions show interest, which search queries bring visibility, and what changed after a campaign or content update. That small set gives students enough evidence to improve marketing without pretending every metric is equally important.
Google’s Analytics reports overview explains that Google Analytics includes overview reports for summaries and detail reports for deeper analysis. The Traffic acquisition report focuses on where visitors and sessions come from, while Google’s Search Console guidance describes Search performance data such as queries, pages, countries, impressions, and clicks. For Rising Edge learners, Digital Marketing pairs naturally with Search Engine Optimization because campaigns and search visibility need different but connected measurements.
Start With the Business or Learning Question
Before opening Google Analytics, write the question you are trying to answer. A beginner does not need a perfect measurement framework on day one. They need a clear reason for looking at the data.
Good starter questions include:
- Most useful visitor channel.
- Pages that keep people engaged.
- Content that leads people toward a form, call, purchase, or course inquiry.
- Search queries that show people are finding the site.
- Campaign changes that improved the intended result.
Those questions are better than a vague goal like “check the analytics.” They turn a dashboard into a decision tool. If the question is about discovery, look at acquisition and Search Console. If the question is about page usefulness, look at engagement and landing pages. If the question is about business value, define the key action first.
Students should also separate learning metrics from business metrics. A class project might track whether a landing page attracted visits and kept readers engaged. A real business might care more about leads, calls, purchases, booked consultations, or admissions inquiries. The dashboard can show both, but the interpretation changes.
Track Acquisition Before Judging Performance
Acquisition tells you where people came from. In beginner terms, this means organic search, paid search, social media, email, referrals, direct visits, or other channels. The traffic source matters because each channel has a different job.
Organic search usually reflects demand from people who are actively searching. Social media may create awareness or repeat visits. Email may bring back people who already know the brand. Referral traffic may come from partners, directories, or mentions. Paid campaigns may bring focused traffic, but they need cost and conversion context before you call them successful.
The mistake is judging all traffic the same way. A social post may bring many quick visits with low intent. A search query may bring fewer visitors but stronger interest. A referral from a trusted education site may be small but valuable. The acquisition report helps beginners ask better follow-up questions instead of celebrating the biggest number.
Use acquisition data to decide where to invest learning time. If organic search is weak, study SEO basics. If social traffic is high but engagement is poor, improve the landing page and message match. If email traffic performs well, learn segmentation and campaign planning. Data should guide the next skill, not just decorate a report.
Measure Engagement With Page Usefulness in Mind
Engagement shows whether visitors interact with the site after arriving. Google’s engagement overview documentation describes engagement data as a way to compare key engagement metrics over time and see which pages or screens people visit. For beginners, the practical test is whether the page gives people a reason to stay, continue, or act.
Useful engagement signals can include engaged sessions, average engagement time, page views, event activity, and which pages people visit next. None of these numbers is perfect alone. A short visit can be good when a page answers a simple question quickly. A long visit can be good when the page teaches something complex. The context matters.
For example, a course overview page should help a visitor understand the subject, curriculum, outcomes, schedule, and next step. If people arrive and leave quickly, the page may not match the visitor’s intent. If they stay but never contact admissions, the call to action may be unclear. If they move from a blog post to a course page, the internal link may be helping the learning path.
Beginners should review engagement at the page level, not only sitewide. A site average hides important differences. A homepage, blog article, course page, contact page, and portfolio page each has a different job. Judge each page against its purpose.
Define Key Actions Before Calling Them Conversions
A conversion is not automatically a sale. It is a meaningful action that shows progress toward a goal. For an institute website, that could be an admissions form, a contact form, a course page visit, a brochure download, or a phone tap. For an ecommerce store, it may be add to cart, checkout start, or purchase.
The beginner mistake is tracking too many weak actions or no actions at all. If every click is treated as a conversion, the report becomes noisy. If no actions are defined, the marketer cannot tell whether traffic mattered.
Start with one primary action and two supporting actions. For example:
- Primary action: admission inquiry submitted.
- Supporting action: course page viewed.
- Supporting action: contact page viewed.
This structure gives the student a practical funnel. Visitors discover the site, read content, view a course, and contact the institute. The exact funnel changes by business, but the habit remains the same: define the action before interpreting the data.
Do not promise that analytics can explain every motive. Data shows behavior. It does not read minds. Use it to form better questions, then compare it with user feedback, sales conversations, and page quality.
Use Search Console for Search Visibility
Google Analytics and Search Console answer different questions. Analytics focuses on site and app behavior after visits are measured. Search Console focuses on Google Search visibility, including queries and pages that appear in search results.
This distinction matters for SEO students. A page may receive impressions but few clicks, which can point to title, snippet, intent, or ranking issues. A page may receive clicks but poor engagement, which can point to page quality or intent mismatch. The two tools work better together than separately.
Search Console can help beginners see which queries bring impressions, which pages get search traffic, and whether visibility changes after content updates. Do not overreact to one day of movement. Look for patterns over weeks, compare pages with similar intent, and connect changes to actual edits.
For Rising Edge learners, this is where the SEO course connects with digital marketing. SEO data explains how people find content in search. Marketing analytics explains what those people do after they arrive.
Build a Simple Beginner Dashboard
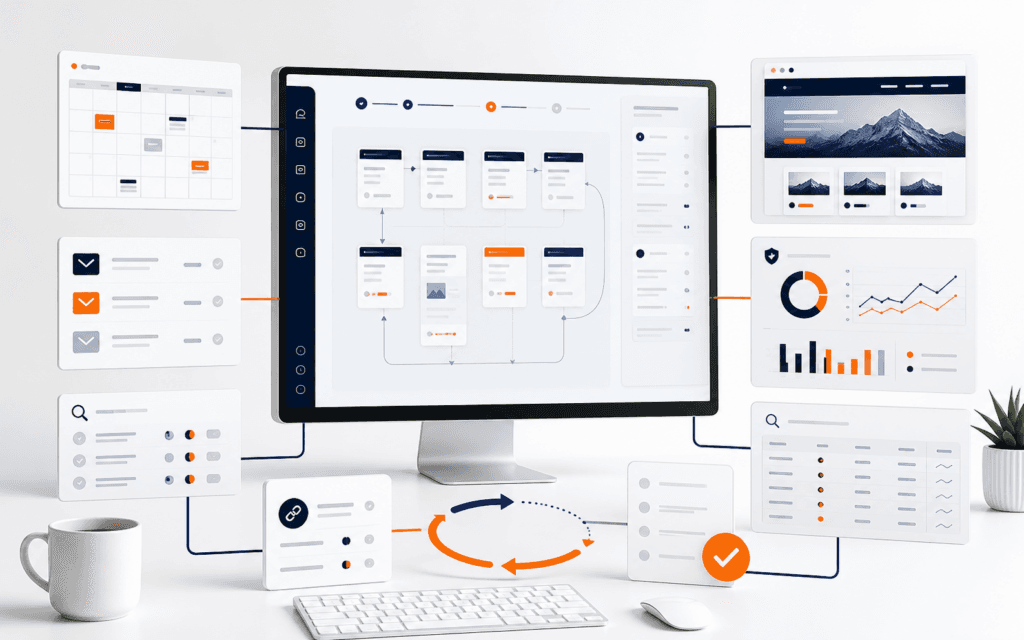
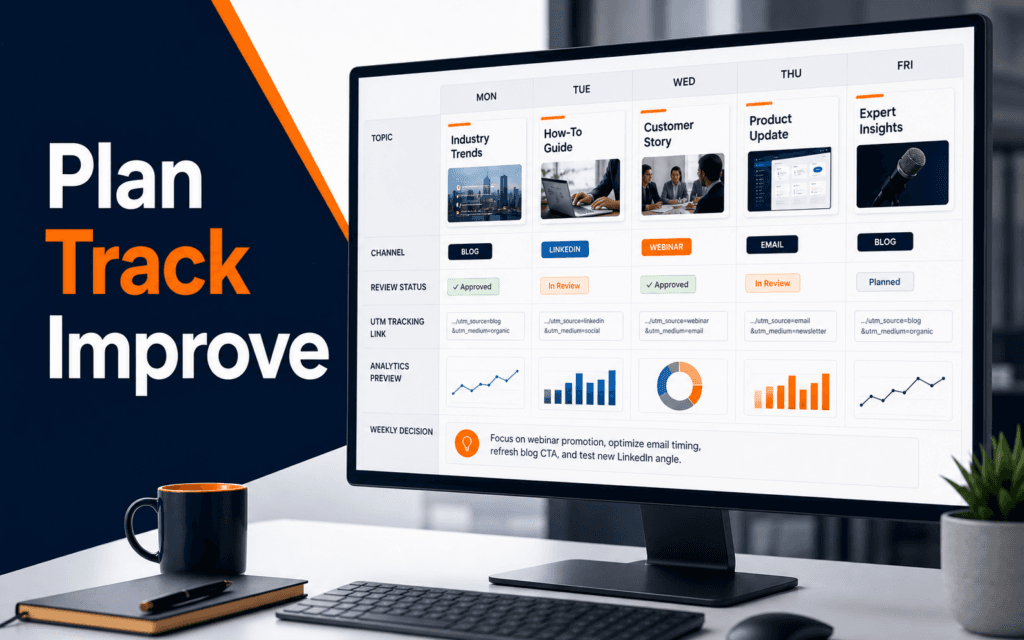
A useful beginner dashboard should fit on one page. It should answer a small set of recurring questions rather than display every available card.
Include these sections:
- Acquisition: top channels or source/medium.
- Engagement: engaged sessions, key landing pages, and top pages.
- Key actions: primary conversion and supporting actions.
- Search visibility: top queries, top pages, clicks, and impressions.
- Notes: campaign dates, content changes, or tracking changes.
The notes section is more important than beginners expect. A spike in traffic means little if nobody records that a new campaign, social post, ad, or blog article went live. Analytics becomes useful when numbers are tied to changes.
Review the dashboard weekly for learning projects and monthly for broader strategy. Daily checking creates noise for small sites. A regular rhythm gives enough time for patterns to appear.
Common Mistakes Beginners Make
The first mistake is reporting numbers without decisions. “Traffic increased” is not enough. Explain what changed, why it might have changed, and what should happen next.
The second mistake is comparing channels without context. Paid traffic, organic search, email, and social traffic behave differently because the visitor relationship is different.
The third mistake is ignoring tracking setup. If forms, events, or tags are not configured correctly, the report may look clean while the data is incomplete.
The fourth mistake is chasing averages. Page-level and campaign-level views usually teach more than a single sitewide number.
The fifth mistake is treating analytics as proof instead of evidence. Data supports a decision, but it still needs interpretation.
This topic also has a local training use for students in Gujrat, Punjab, Pakistan: the practical approach in this article can be compared with practical exercises in the Digital Marketing. Confirm current batch requirements directly and judge the learning path by inspectable work.
FAQ
What should beginners track first in digital marketing analytics?
Track acquisition channels, landing pages, engagement, key actions, and Search Console visibility before building complex dashboards.
Is Google Analytics enough for SEO reporting?
No. Google Analytics helps explain site behavior, while Search Console helps explain Google Search visibility through queries, pages, clicks, and impressions.
How often should students review analytics?
Weekly review works well for learning projects. Monthly review is better for broader strategy because it reduces noise and makes patterns easier to see.
Next Step
Choose one website or class project and write three questions before opening any tool. Then build a one-page report that answers only those questions. That habit turns analytics from a confusing dashboard into a practical marketing skill.
Want to Build Practical Technology Skills?
Explore RisingEdge courses designed to help students learn real skills, build projects, and prepare for career opportunities.