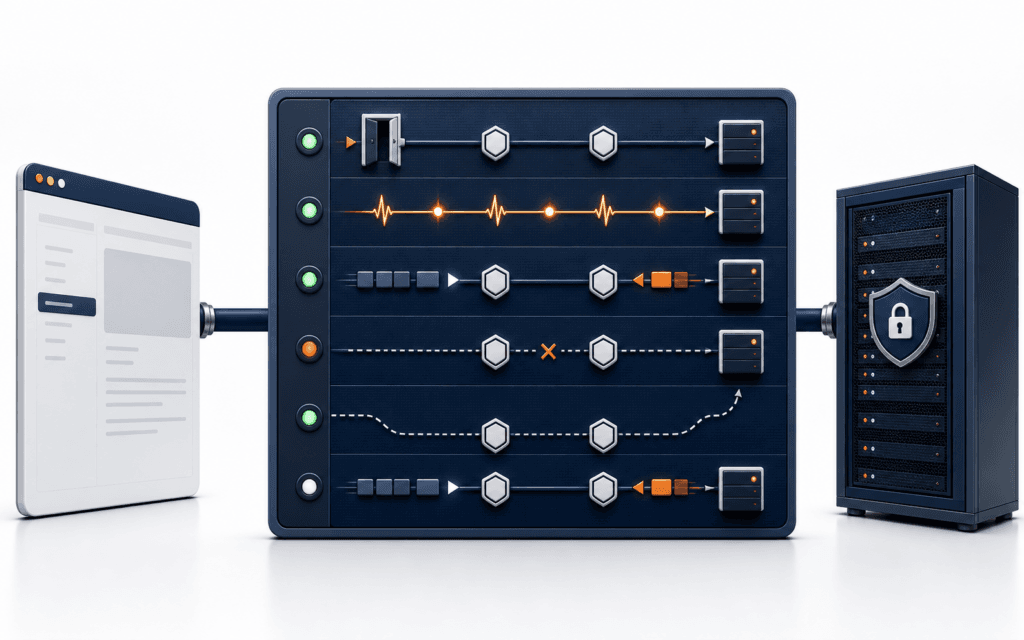
Web Development Debugging Workflow: Console, Network, Server, Deploy
A web development debugging workflow helps you move from a vague bug report to the exact failing layer. Start by reproducing the issue, then check the browser, network request.


A web development debugging workflow helps you move from a vague bug report to the exact failing layer. Start by reproducing the issue, then check the browser, network request, server response, data path, and deployment environment in order.
MDN explains how the web works through requests, responses, delivered code, and browser assembly. That matters because a web bug can appear in the interface while the real cause sits in JavaScript, HTTP, server logic, database state, or deployment configuration.
Reproduce The Bug First
Do not start changing code from a screenshot. Reproduce the bug with exact steps, browser, viewport, account state, input data, and expected result. If you cannot reproduce it, you cannot prove it is fixed.
Write the shortest repeatable path. For example: open the admissions page, select a course, enter an invalid phone number, submit the form, and observe that the error appears below the wrong field.
A repeatable path prevents random edits. It also helps teammates test the same behavior after a fix.
Name The Expected Behavior
Many debugging sessions fail because nobody states what should happen. Write the expected result in plain language: the form should reject invalid input, keep typed values, show one clear error, and avoid sending email.
Expected behavior should match user needs and technical rules. If the design says the button is disabled but the API accepts the submission anyway, the workflow still has a bug.
The Web Design course connects here because visual behavior, labels, spacing, and error states are part of debugging the real user experience.
Check The Browser Console
The console shows JavaScript errors, warnings, failed assumptions, and sometimes useful framework messages. Read the first relevant error before chasing later symptoms.
Common frontend issues include undefined values, failed imports, event handlers not firing, hydration differences, invalid JSON parsing, blocked resources, and state changing in the wrong order.
Do not silence console errors just to make the page look clean. Fix the cause, then reload and confirm the message disappears.
Inspect The DOM And Styles
Some bugs are not logic bugs. The element may exist but be hidden, overlapped, disabled, outside the viewport, or styled differently on mobile. Inspect the DOM, computed styles, layout boxes, and focus state.
Check whether labels are connected to inputs, buttons are reachable by keyboard, and error messages appear near the relevant field. A form can technically submit while still failing the user.
For responsive bugs, test at several fixed widths instead of dragging randomly. Record the width where the issue begins.
Use The Network Panel
The network panel tells you whether the browser sent the request, where it went, what method it used, what payload it carried, what status came back, and what response body returned.
A failed API call may be a frontend URL bug, CORS issue, authentication problem, validation failure, server exception, timeout, or bad payload. The status code and response body usually narrow the search.
Compare a working request with a failing request. Differences in headers, cookies, body fields, and query strings often reveal the cause quickly.
Verify Server Behavior
If the request reaches the server, inspect server logs and route logic. Check validation, authentication, permissions, database calls, external API calls, and error handling.
Do not trust the frontend to protect the backend. Server routes should validate required fields, reject unsafe input, and return useful but not sensitive error messages.
The Full Stack Web Development course is relevant because reliable debugging requires understanding both browser and server responsibilities.
Check Data And State
Many bugs are data problems. A page may fail because a field is missing, a record is unpublished, a slug changed, an enum value is unexpected, or an API returned an empty array.
Inspect the actual data, not only the component. Confirm IDs, slugs, dates, statuses, related records, and permissions. If a bug happens only for one user or one course, data is a likely suspect.
Add defensive handling for empty and unexpected states. A production page should fail clearly, not collapse because one optional field is absent.
Compare Local And Production
Deployment introduces differences. Environment variables, build commands, redirects, domains, caches, runtime versions, asset paths, and secrets can differ between local and production.
MDN’s deployment guidance includes pushing code, deploying, and adding simple tests. For professional work, treat deployment as a testable stage, not the end of the task.
Use a checklist: build output, environment variables, API base URL, public assets, redirects, form delivery, authentication, caching, and logs.
Watch Caching And Stale Assets
Some production bugs are fixed in code but still visible because a browser, CDN, framework cache, or service worker is serving an older asset. Check whether the failing JavaScript or CSS file is the new build.
Hard refresh, inspect response headers, compare asset hashes, and verify the deployment timestamp. If a CDN is involved, confirm purge behavior before assuming the code is still wrong.
Caching bugs are frustrating because they make two people see different versions of the same page. Record the exact URL, device, cache state, and build version during the investigation.
Check Accessibility While Debugging
Accessibility bugs often appear during ordinary debugging. A button may work with a mouse but not keyboard. An error may be visible but not announced. A modal may open but trap focus incorrectly.
When inspecting the DOM, check labels, heading order, alt text, focus outlines, disabled states, and keyboard flow. These checks do not need to wait for a separate audit.
Fixing accessibility during debugging reduces repeated work because the same code path often controls visual state, input state, and assistive technology behavior.
Inspect Forms End To End
Forms deserve their own debugging pass because they cross many layers. A form includes labels, validation, input state, submit handling, API routing, server validation, email or database writes, success messages, and duplicate-submit protection.
Test valid data, empty fields, invalid formats, long messages, slow network, server errors, and repeated clicks. Watch whether the button state changes, whether the payload is correct, and whether the user receives a clear response.
If the form sends email, verify the server-side result instead of assuming success from the frontend message. A page can show success while SMTP failed silently.
Debug With One Change At A Time
Changing several files at once may make the bug disappear without explaining why. Make one change, test the reproduction path, and record the result.
If the change fails, revert only your own debugging experiment and try the next hypothesis. Keep the real fix small and tied to the verified cause.
This habit saves time in team settings because reviewers can understand the fix and the test evidence.
Add A Regression Check
After fixing the bug, add a manual or automated regression check. A manual check can be a short note in the ticket. An automated check may be a unit test, integration test, or browser test.
For forms, test valid input, invalid input, empty input, duplicate submit, and server failure. For pages, test desktop, mobile, missing data, and loading state. For APIs, test success, validation error, unauthorized request, and unexpected input.
Cross-browser testing matters because different browsers and devices can expose different behavior. MDN describes cross-browser testing as a way to identify and debug common browser problems.
Write The Handoff Note
A good debugging handoff includes symptom, cause, changed files, verification steps, residual risk, and any follow-up work. This is especially important for production issues.
Do not write fixed without saying how. A future developer should be able to reproduce your thinking and rerun the checks.
The WordPress Development course also benefits from this discipline because CMS work often combines themes, plugins, REST calls, cached pages, and published content.
Practice With Realistic Bugs
Do not only practice by solving syntax errors. Create realistic exercises: a form submits twice, a mobile menu traps focus, an API returns a 401 in production, a product image path breaks after deployment, or a page works locally but fails with missing environment variables.
For each exercise, write reproduction steps, likely layers, inspected evidence, final cause, and verification. That format builds debugging judgment much faster than watching tutorials passively.
A working professional becomes valuable when they can keep the investigation calm, evidence-based, and reversible even when the issue affects a live project.
Build A Personal Debugging Template
Keep a reusable note template for bugs. Include summary, reproduction steps, environment, expected behavior, actual behavior, inspected evidence, suspected layer, fix, verification, and follow-up.
This template prevents missing details when pressure is high. It also helps instructors, teammates, and future you understand what happened without reopening the whole investigation.
Over time, the template becomes a learning record. You will notice which mistakes repeat: missing environment variables, weak validation, bad assumptions about data, or responsive styles tested too late.
Final Workflow
Use this order: reproduce, define expected behavior, inspect console, inspect DOM and styles, inspect network, verify server logic, check data, compare deployment, change one thing, retest, and write the handoff note.
Debugging is not guessing faster. It is reducing uncertainty until the smallest correct fix becomes visible.
Students considering technology training in Gujrat, Punjab, Pakistan can use this workflow to judge the practical depth of the Full Stack Web Development. The useful evidence is the work a learner can explain, test, and improve, not a list of tools alone.
FAQ
What is the first step in web debugging?
Reproduce the bug with exact steps, input, browser, viewport, account state, and expected behavior before changing code.
When should I check the network panel?
Check it when a feature depends on an API, form submission, image, script, authentication state, or data request.
Why do bugs happen only after deployment?
Production can differ in environment variables, build settings, domains, caching, runtime versions, redirects, and external service credentials.
Want to Build Practical Technology Skills?
Explore RisingEdge courses designed to help students learn real skills, build projects, and prepare for career opportunities.